Category: Paleoclimatology
Sub category: the isotope thermometer of the ice cores.

André Bijkerk
Abstract
The Anthropogenic climate change hypothesis has its roots in the climate reconstructions based on the ice core records of Antarctica and Greenland. Isotope ratios of oxygen and hydrogen in the ice are assumed to be proxies for global temperature. However, if we zoom in on specific periods, for instance the so called “mystery interval”, we find abundant evidence that does not support that hypothesis. This blog elaborates on this issue, and demonstrates that it’s essential to revisit the ice age theories, which will be subject of subsequent blogs.
Samenvatting
Antropogene klimaatverandering heeft zijn wortels in de klimaatreconstructies van de ijskernen van Antarctica en Groenland. Isotopenverhoudingen van zuurstof en waterstof in het ijs worden verondersteld proxies, benaderingen, te zijn voor de mondiale temperatuur. Maar als we inzoomen op specifieke periodes, bijvoorbeeld vandaag hier, het “mysterie-interval”, vinden we overvloedig bewijs dat deze hypothese niet ondersteunt. In deze blog wordt dit probleem nader toegelicht en wordt aangetoond dat het van essentieel belang is om de ijstijdtheorieën opnieuw te bekijken, die het onderwerp zullen zijn van volgende blogs.
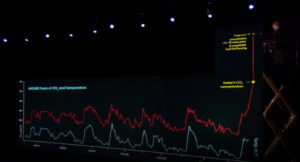
Fig 1 Al Gore on the scissors lift
Introduction
The Anthropogenic Global Warming (AGW) hypothesis began to gain weight with the polar ice core research. Over three kilometer deep narrow borehole cores were drawn from the ice sheets of Greenland and Antarctica and analyzed on chemical and physical properties like carbon dioxide and methane in gas bubbles and isotope ratios of hydrogen and oxygen of the ice, thought to represent temperatures of the past ice ages. It was concluded that there was a very high correlation between those carbon dioxide and isotope ratios between cold periods of advancing ice, and apparent warmer intermezzo’s, the interglacials.
And that was it: the onset of the AGW hypothesis, as famously illustrated by Al Gore on his scissors lift in an inconvenient truth (fig 1).
Discussion
The meaning of these graphs is totally dependent on the correct interpretation of the data and the correctness of the assumptions about the relationship between these isotopes in the ice and the temperatures.
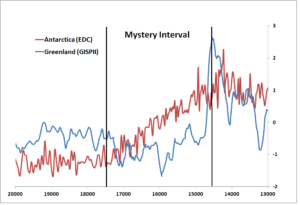
Fig 2, comparing Greenland temperature reconstruction of Alley 2004 with Antarctica temperature reconstruction of Epica DomeC Jouzel et al 2007 (between 20 and 13 thousand years ago. Y-axes: normalized comparison. Zero is average over the interval and the unit is standard deviation
We now zoom in on a specific period in that era, between 20,000 and 13,000 years ago as the world came out of the last glacial maximum (fig 2) looking at both proxy reconstructions of the Greenland temperature (Alley 2004) and Antarctic temperature (Jouzel et al 2007) based on isotope ratios in the ice cores (the isotope thermometer).
Apparently Antarctica came out of the ice age gradually between 17.5 and 14 thousand years, while Greenland appeared to linger on in the freeze until a sudden warming spike some 14.5 thousand years ago, a.k.a. the Bølling-event. How to deal with this mismatch? We start off calling it a mystery; it’s the mystery interval (Denton et al 2006).
Obviously this mismatch has been a source for numerous speculations and discussions and there are several options to consider:
- First hypothesis. The temperature split is correct; there was indeed a big temperature difference between the two hemispheres during that period.
- Second hypothesis. The temperature changes were actually quite synchronous, however the local isotope thermometer was disturbed by local changes like the isotope fingerprint of the abundant glacial melt water and changing weather cycles.
- Third possibility: falsifying the isotope thermometer. Neither Antarctic nor Greenland ice core isotopes are temperatures, the isotopes in the ice cores are not a reliable proxy for temperatures.
To judge the first hypothesis, we can investigate other hemispheric records of that time to see if we can learn more about temperatures. We find for instance:
Denton et al 2006 assume the cause for the mystery interval to be hyper cold winters, yet, massive retreat of glaciers on the Northern hemisphere. They propose that a massive ice berg discharge from North America, known as Heinrich Event H1, effectively shut down the Thermohaline Current. This would have caused a very cold arctic environment, while temperatures on lower latitudes could have been remained higher. However, if extensive winter sea ice is dominating the Arctic sea, then it certainly has its impact on the Arctic continent, eg Siberia. Hence we must find the same hyper-cold conditions back in the period 17,500-14,500 years before present.
Hubberten et al 2004 summarizes the results of studies of the Late Weichselian periglacial environment of Northern Eurasia and finds from multiple proxies a remarkable warming around radiocarbon dated period starting at 15000 years, which must be calibrated to about 18700 calendar years before present[1]. For instance, using insect assemblages in the area of the Laptev sea (fig6 pp1339, see below), they define the “warmest tundra steppe” between about 10 and 15 thousand radiocarbon years ago (calibrated to 11.2-18.7 thousand calendar years ago) with a dramatic increase of xerophilous (=warmth loving) insects from an average <20% to a 60-70% spike around 14 thousand radiocarbon years, calibrated to 15.7 thousand calendar years ago. It may be noted that the Northern Hemisphere summer insolation at that time was halfway the transition from a minimum around 22-23 thousand years ago to a maximum around 9-10 thousand calendar ago, which would not suffice to explain the unusually high temperatures. It may be clear that extensive sea ice in the Laptev sea would not concur with these results.
Extensive sea ice is furthermore not compatible with the results of Lagerklint & Wright (1999) using high-resolution faunal, isotopic, and sedimentologic data from a North Atlantic core to show that sea-surface temperatures increased from 17.5 to 17.3 thousand years ago but also contend that during Heinrich event HE1, the sea surface temperature decreased again. Denton et al suggested that the Mediteranian sea was also unusually cold however Carboni et al (2005) investigate the ratio of plancktonic cold and warm taxa in the Tyrrhenian Sea, and find warming already at 16,3 thousand radiocarbon years and progressing climate fluctuations as of 15.0 thousand radiocarbon years ago which converts to 19.0 and 17.7 calendar years before present.
Hill et al (2006) find also indications of early deglacial warmth two thousand years before the formal termination and remark that those findings “are consistent with a growing number of records from around the globe that exhibit pre-Bølling warming prior to Termination IA, and extends the record of such processes to the northern Pacific Discussion”.
The conclusion must be that the records do not support the hypothesis of Denton et al (2006), which attempts to explain the contradictions in the records of the mystery interval with still very cold conditions. The Northern hemisphere did warm up including the Arctic region, despite the cold indications of the isotope thermometer. That means that the first hypothesis can be considered falsified.
So the question is now if the isotope anomaly of Greenland is a local effect due to large changes in the water cycle and weather (hypothesis two), or if the isotope paleo-thermometer is just not working at all. After all, the melting of the Laurentide ice sheet must have produced a lot of light water isotopes, contaminating the normal isotope ratios. For this we would like to have other isotope reconstructions originating farther away from Greenland, to see if these are more a match for Antarctica, and those are available in speleothems (stalagmites and stalactites) and oceanic sediments much further away from Greenland.
So if the second hypothesis is correct, then the typical lack of increase of the record before the Bølling event and then the sudden spike should only be visible near Greenland. However, it’s around in some format practically everywhere. To name a few: in the speleothems of China (Wang et al 2001), Turkey (Fleitman et al 2009), in the sediment cores of the Atlantic ie Cariaco basin (Hughen et al 1998), the Pacific (Kennett and Ventz 1995) and even close to Antarctica (Andersen et al 2009, Zhang et al 2016). Consequently the Bølling event was not restricted to the region of Greenland. It can be traced back in some form at numerous places. Scholars assume the origin might be oceanic (Broecker & Putnam 2012). But that’s a subject for another blog later.
Conclusion
Greenland’s paleo-thermometer of the ice cores suggests that Greenland came out of the deep cold of the Last Glacial Maximum suddenly at the onset of the Bølling event around 14.5 thousand years before present, while Antarctica’s warming was initiated much earlier around 17.5 thousand years ago. However, multiple other records show widespread pre-Bølling warming, while the typical Bølling spike is visible in many records around the globe. Consequently neither the first hypothesis about the temperature split, nor the second hypothesis about local disturbance at Greenland can be correct. Hence the isotopes in the ice cores of Greenland are not a reliable proxy for temperatures, challenging the theories about the Pleistocene ice ages.
To be continued.
References.
Alley, R.B.. 2004. GISP2 Ice Core Temperature and Accumulation Data. IGBP PAGES/World Data Center for Paleoclimatology Data Contribution Series #2004-013. NOAA/NGDC Paleoclimatology Program, Boulder CO, USA.
Anderson, R. F., Ali, S., Bradtmiller, L. I., Nielsen, S. H. H., Fleisher, M. Q., Anderson, B. E., & Burckle, L. H. 2009. Wind-Driven Upwelling in the Southern Ocean and the Deglacial Rise in Atmospheric CO2. Science, 323(5920), 1443–1448. doi:10.1126/science.1167441
Broecker W., A. E.Putnam 2012, How did the hydrologic cycle respond to the two-phase mystery interval? Volume 57, 4 December 2012, Pages 17-25 Quaternary Science Reviews
Carboni G, L Bergamin, L Di Bella, B Landini, L Manfra, P Vesic 2005, Late Quaternary paleoclimatic and paleoenviromental changes in the Tyrrhenian Sea, Quaternary Science Reviews Volume 24, Issues 18-19 , October 2005, pp 2069-2082
Denton, G.H, WS Broecker, RB Alley, 2006; The mystery interval 17.5 to 14.5 kyrs ago, Pages Volume 14 No 2 August 2006, pp14-17
Fleitmann, D., Cheng, H., Badertscher, S., Edwards, R.L., Mudelsee, M., Goektuerk, O.M., Fankhauser, A., Pickering, R., Raible, C.C., Matter, A., Kramers, J., Tuysuz, O., 2009. Timing and climatic impact of Greenland interstadials recorded in stalagmites from northern Turkey. Geophys. Res. Lett. 36
Hill T.M., J.P. Kennett, D.K. Pak, R.J. Behl, C. Robert and L. Beaufort, 2006. Pre-Bølling warming in Santa Barbara Basin, California: surface and intermediate water records of early deglacial warmth, Quaternary Science Reviews Volume 25, Issues 21-22, November 2006, Pages 2835-2845
Hubberten et (21) al 2004. The periglacial climate and environment in northern Eurasia during the Last Glaciation, Quaternary Science Reviews 23 (2004) 1333–1357
Hughen, K. A., Overpeck, J. T., Lehman, S. J., Kashgarian, M., Southon, J., Peterson, L. C., … Sigman, D. M. 1998. Deglacial changes in ocean circulation from an extended radiocarbon calibration. Nature, 391(6662), 65-68. https://doi.org/10.1038/34150
Jouzel, J., et al 2007. Orbital and Millennial Antarctic Climate Variability over the Past 800,000 Years. Science, Vol. 317, No. 5839, pp.793-797, 10 August 2007
Kennett, J., and K. Venz, 1995. Late Quaternary climatically related planktonic foraminiferal assemblage changes: Hole 893A, Santa Barbara Basin, Proc. Ocean Drill. Program Sci. Results, 146(2), 281 – 293, 1995
Lagerklint M, J.D. Wright 1999. Late glacial warming prior to Heinrich event 1: The influence of ice rafting and large ice sheets on the timing of initial warming. Geology; December 1999; v. 27; no. 12; p. 1099–1102;
Reimer P.J. et al 2013, IntCal13 and Marine13 Radiocarbon Age Calibration Curves 0–50,000 Years cal BP, Radiocarbon Vol 55, No 4 (2013)
Wang, Y.J., Cheng, H., Edwards, R.L., An, Z.S., Wu, J.Y., Shen, C.C., Dorale, J.A., 2001. A high-resolution absolute-dated Late Pleistocene monsoon record from Hulu Cave, China. Science 294, 2345–2348.
Zhang, H., Griffiths, M. L., Huang, J., Cai, Y., Wang, C., Zhang, F., … Xie, S. 2016. Antarctic link with East Asian summer monsoon variability during the Heinrich Stadial–Bølling interstadial transition. Earth and Planetary Science Letters, 453, 243–251.
[1] Due to multiple complications, like changing ratios of radiocarbon concentrations in the CO2 of the atmosphere, the radiocarbon dating requires calibration, by comparinjg with other records. Reimer et al 2013
André,
Thanks for these remarkable findings! Your logic seems quite solid, suggesting that your conclusion is as well.
The only flaws that I can think of are:
Hypothesis 1: You disprove the Denton theory convincingly, but does that really falsify the first hypothesis? Could another – local – phenomenon cause the low temperatures in Greenland, so that they do not have to show in other regions?
This of course means that you would have to rephrase your definition of the first hypothesis:
“… The temperature split is correct; there was indeed a big temperature difference between the Greenland ice cap and the Antarctic ice cap during that period.”
Hypothesis 2: The assumption of a regional effect that is fooling the isotope thermometer is also disproved convincingly. But again: is that the only possible explanation? The ice that is sampled is purely derived from snow, falling at app 3 km high, on a 3 km thick ice cap, with usually very low temperatures. That is a quite specific situation, which only occurs in Greenland and Antarctica.
Doesn’t that open other possibilities for fooling the isotope thermometer?
Thanks Theo for your questions and I’m sorry if I was not too clear about this.
Hypothesis 1: There is very little other -non isotope proxy- evidence directly from Greenland during the mystery interval to back up or refute the isotope thermometer, the best we may have currently -as far as I know- is Hubberten et al 2004, about paleobiological proxies in at the Arctic ocean Northern Siberia (not too far away) showing the diagram as I uploaded as Hubberten2004 and that should have shown up here: (but instead moved to the bottom of this comment)
It pertains fig 6 on page 1339 about fossil insect remains on the Bykovsky Peninsula https://epic.awi.de/9052/1/Hub2004a.pdf
Take into account that 17500-14500 calendar years inversely calibrates to 14350-12400 radiocarbon years (Reimer 2013) and that brings us in the middle of the period
which wouldn’t support that the Arctic region was as cold as the isotope proxies suggest.
About hypothesis2. Indeed the isotope ratios on the ice cap summits are extremely depleted of 18O en 2H (in winter time!) due to a few processes. One way to fool the isotope thermometer is to cut back on winter precipitation/snow, just having summer precipitation. After all the isotope thermometer only works as it snows/rains. So the average yearly isotope ratio is very dependant on the winter/summer precipitation ratio. But this is all noted and taken care of in scholar publications. I will elaborate on other processes later that are not taken care of (humidity).
I agree that you make a compelling case for the disproval of hypothesis 1, and I for one am convinced.
I just hesitate to say it is really disproved because we cannot imagine a situation where the top of the ice cap is significantly colder than Siberia or the ocean surface. That might be a lack of imagination instead of proof.
I’m looking forward to your next contribution!
Theo, the point is that the isotopes from the ice cores tell a complex story about the watermolecules from evaporation from the ocean until it was retracted from the ice cap. Since, after it fell on the ice cap it got covered and crunched under the weight of next snowfall. And then again, it might even tell something before it evaporated i.e. ocean interactions. Consequently it tells nothing about the actual temperature on the surface of the ice sheet. I will elaborate about that soon.
That may very well be true and it would be a great explanation of the mystery interval, so I am looking forward to your next posting. But now I am talking about the logic of disproving hypothesis 1 that there was a great temperature difference between the two hemispheres. I don’t think that (dis)proof is 100% solid yet. Though you bring very convincing evidence.
@Andre
First of all congratulations with the first paper on the new site.
I am not that familiar with temperature analysis of proxy data of isotopes. In general, I am not a real fan of proxy data without thorough calibration. For example, the tree ring study of the Ural by Briffa e.a (CRU) assumed dependency on temperature only, while a dependency on precipitation is more likely (Ural is a cold desert). Forgive me I did not read (yet) the mentioned literature in your paper.
However, reading your paper a few questions arise. From the paper I understood that you mainly looked at data regarding Q16/O18 and H1/H2 ratio in water and not inclusions in the ice of air (CO2,O2,CH4) that may change in due time (pressure,(bio)degradation). There is of course a major difference between these inclusion data, which may explain the local (air) conditions at deposition of the water (snow), while the isotope ratios explain more the conditions at origin during evaporation. I guess that the temperature during evaporation, the variation in precipitation and the predominant direction of the wind could affect the ratio of the isotopes due to the dependency of its origin.
My question is twofold: are local data(air, bio-data) in agreement with the non-local isotope data. Secondly, assuming that the predominant direction of the wind is west both in Greenland and on Antarctic, is the rather different geography of land west of Greenland and sea conditions west of Antarctic a possible explanation. Changes and variation in the temperature of sea (current) may explain a lot.
I agree with your analysis and conclusion that the isotopes are not a reliable proxy, but I like to have an explanation why not.
Peter, Thanks,
I am currently working on an entry to be published soon to elaborate on the isotope fractination process in the water cycle all the way to the ice sheets and what problems could arise, which are not in the textbooks.
Next, I intend to demonstrate that there are more periods in the late Pleistocene in which local bio data do not match the non-local isotope data (i.e. Younger Dryas and MIS-3) and how a modification of the Milankovitch cycles could fit the MIS-3 problem.
Yes the ocean, part of the answer most certainly, but probably in a different way than we think, especially for the 100,000 years non-Milankovitch cycle.
Plenty more about that to come in the next months.
How do these ice core d18O anomalies compare with the globally averaged benthic stack?
Lisiecki, L. E., and M. E. Raymo (2005), A Pliocene-Pleistocene stack of 57 globally distributed benthic d18O records, Paleoceanography, 20, PA1003, doi:10.1029/2004PA001071
Hans,
Excellent question, which I intended to address in maybe sequel 4 or 5. The major anomaly in the LR04 reconstruction (and earlier versions) is the switch from the ’41k world’ to the ‘100k world’, just about one million years ago. That’s the major issue to address. Meanwhile maybe google ‘Spero, Lea, foraminifera, CO2’. The answer is most likely CO2, but not in any way related to climate, just to the ocean only.
André, a serious word of advice. I think it is not the proper way to conduct a scientific debate if you keep stuff hidden in your argument. Your writing style is teaching and trying to let your “pupils” think and come to your conclusions instead of giving the conclusions yourself. Try to explain everything you think beforehand so your audience can comment on that. I see only questions in this posting, not conclusions, try to be concise and to the point.
ps love the edit functionality!
Hans,
I appreciate your comments. I do have to find the right formulae. Oviously it’s of major importance to address lay people, who have no idea about the LR04 benthic stack or the Stilostomella extinction event or even the Huybers modification of the Milankovitch cycles.
Again, the main objective is to demonstrate that the 100k cycle is not a climate cycle but an oceanic CO2 cycle, which modifies the d18O of the foraminifera as well as the natural stratification of ocean water, which you would normally expect, caused by the downwelling of heavy surface water in the thermohaline cycle, but which we don’t see today.
But how to explain all that to others whilst the outcome –CO2 is not a climate cycle– is vital?
So I chose to go one step at the time, but I’m happy to announce the big objective in the next contribution.
André, assuming the temperature reconstructions are correct, but the GISPII reconstruction is only representative for Greenland. If rest of the world came out of the glacial more like the EDC reconstruction a possible mechanism could be the following:
during the glacial the Nordic seas and the Arctic ocean are covered with a permanent sea ice sheet.
This sheet extends south of the Greenland-Scotland Ridge (GSR), so no brine/cold water sinks north of the GSR into the deeper waters. The Gulfstream is not entering the Nordic seas either, so these waters are pretty much isolated from the rest of the worlds oceans.
https://www.uib.no/sites/w3.uib.no/files/styles/content_main_wide_1x/public/w2/at/atlantic-det4.jpg
Under the ice sheet the waters warm up due to the geothermal energy (flux and erupting magma). Depending on the depth of the waters and the amount of geothermal energy that warms these waters the temperature could rise iK every 1-2000 years. When warm enough the ice sheet can disappear rapidly and expose the already warmer water, explaining the rapid rise in temperature in the area.
Thanks Ben, you’re way ahead of me
I’m about to post about the physics of isotope fractionation in the water cycle, showing that the isotope variation in precipitation is not so much about ambient temperature but more about relative humidity. Isotope variation in ice sheets is even more complex due to mixing of annual layers under compression. These are universal problems, including Antarctica. Then we will have a close look at the isotope interaction with the oceans to get some ideas about the possible real cause of events during the Pleistocene ice ages.
Spoiler: https://www.climategate.nl/2016/02/52878/