
André Bijkerk
Isotopes in precipitation are essentially not a proxy for temperature but for humidity.
Category: Paleoclimatology and Atmosphere
This is the fourth post in series with the objective of revisiting the Pleistocene ice ages, demonstrating that several well-accepted scientific practices don’t hold up very well in the big picture. In the previous posts we have concluded that the isotope paleo thermometer of the Greenland ice cores does not generally match other records especially during the transition from the last glacial maximum towards the Holocene. Here we intend to find out why.
Abstract
The Anthropogenic global warming view has its roots in the climate reconstructions based on the ice core records of Antarctica and Greenland. Isotope ratios of oxygen and hydrogen in the ice are generally accepted to be proxies for global temperature. Here we focus on the basic processes of evaporation, condensation and lateral transportation in the hydrologic cycle, combining them with basic meteorological principles. We find that the initial isotope ratio (δ18O) in the water cycle is hardly dependent on temperature but is strongly related to the relative humidity at the evaporation source. During lateral transport of the air mass to the ice sheets, the Rayleigh rain-out effect of 18O isotopes is largely dependent on specific humidity. Furthermore, the ratio of summer and winter precipitation during the accumulation of ice complicates matters further. These additional factors obscure the temperature signal, which would invalidate the isotope thermometer of the ice cores.
Samenvatting
De antropogene klimaatverandering hypothese heeft zijn wortels in de klimaatreconstructies van de ijskernen van Antarctica en Groenland. Isotopenverhoudingen van zuurstof en waterstof in het ijs worden verondersteld proxies, benaderingen, te zijn voor de mondiale temperatuur. We verkennen de basisprocessen van verdamping, condensatie en lateraal transport in de hydrologische cyclus, waarbij ze worden gecombineerd met elementaire meteorologische principes. We vinden dat de initiële isotoopverhouding (δ18O) in de waterkringloop nauwelijks afhankelijk is van de temperatuur maar sterk gerelateerd is aan de relatieve vochtigheid bij de verdampingsbron. tijdens laterale transport van de luchtmassa naar de ijskappen (advectie) is het Rayleigh-uitregeneffect van 18O isotopen hoofdzakelijk afhankelijk van specifieke vochtigheid. Bovendien compliceert de verhouding van zomer- en winterneerslag tijdens de opeenhoping van ijs de zaak verder. Deze extra factoren vertroebelen het temperatuursignaal, waardoor de isotoop-thermometer van de ijskernen onbruikbaar lijkt.
Introduction
In the nineteenth century, researchers became preoccupied with the ice ages and hence finding ways to reconstruct the climate of the past. It was recognized that the large ice sheets of Antarctica and Greenland may contain records of the past, which would facilitate understanding mechanisms for the ice age. Much thought was given to ways to reconstruct global temperatures of the past. Eventually Dansgaard[i] compiled a method, using stable isotopes in the ice which aimed to do that. Based on this method, several temperature reconstructions were made of the last few hundred thousand years. However, numerous problems arose; many biological and other geologic records did not always concur, like the Mystery Interval and Younger Dryas elaborated upon here earlier. In addition, Helsen[ii] did contemporaneous research on Antarctica and could not find any support for the method. Looking at Dansgaard’s research and also subsequent and more research on ice cores such as Cuffey[iii] and Jouzel[iv], merely stating that the isotopes record the cloud temperatures, it is obvious that they did not integrate meteorologic principles into the equation.
Therefore we will revisit the first basic principles of the paleo isotope thermometer of the ice cores, taking into account the properties of air masses in the atmosphere and the hydrological cycle, starting off with the initial evaporation phase, then the transportation phase and finally the accumulation phase on the ice sheet.
General
The atoms hydrogen and oxygen in water, H2O, do not all have the same mass. In the classical model, the core of nearly all hydrogen atoms contain one proton, however there are a few atoms that contain also a neutron, indicated as 2H or D for Deuterium, a heavier isotope, doubling the weight of the hydrogen atom. Oxygen normally comes with 8 protons and 8 neutrons, called 16O, but some have an extra neutron in the nucleus, making 9 neutrons, which is called 17O (rare) or even ten neutrons in the oxygen nucleus, referred to as 18O (about one in 500 atoms). Most research on isotopes in precipitation is focused on the latter. Although heavy H218O water has the same chemical properties, it has slightly different physical properties compared to the lighter H216O water. As in a body of molecules, they all typically have the same average energy and momentum. Consequently, more mass of the heavier isotopes means less average speed. This lower velocity impedes evaporation but promotes condensation compared to the lighter molecule. Therefore the water vapor pressure in equilibrium is slightly lower for the heavier water molecules.
Moreover, the vapor pressure ratio between the lighter and the heavier isotopes (α) is temperature dependent (Fig 1) as temperature is equivalent to kinetic energy i.e. speed of the molecules. This is thought to be one of the main principles of the isotope thermometer
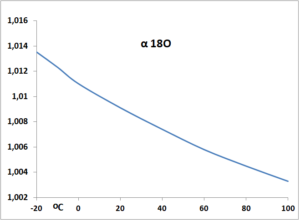
fig 1, Ratio of partial vapor pressure between 16O and 18O compiled from data from Dansgaard 1964
Initial evaporation phase.
When water evaporates, fractionation takes place and the vapor is slightly depleted of 18O. The difference in ratio between 16O and 18O, compared to a certain standard of sea water (VSMOW), and it is annotated as δ18O in 1/1000 parts or per mil (‰) in comparison to the standard. A typical value is -10‰ at room temperature. When this water condenses again at the same temperature, the fractionation is reversed, as the heavier isotopes tend to condense slightly faster, enriching (or rather, decreasing the depletion of) the condensation water back again to a net result of zero. This is a dynamic equilibrium. However when the moist air is removed away and the vapor condenses under other conditions, fractionation will occur again.
As Katsaros points out, the rather highly saturated air in the boundary layer will mix initially with higher and drier layers of air, due to wind/wave interaction i.e. turbulence. Also advection of colder or warmer air masses over warmer or colder oceans will drive convection. Obviously the resulting relative humidity of de rising air is dependent on many parameters.
As the warm air mass rises up it will cool adiabatically, raising the relative humidity until it reaches 100% at the so-called dew point. Now the condensation of water starts again, forming clouds, but obviously at a distinctly lower temperature, where the partial vapor pressure of 18O is lower than at the surface temperature according to fig 1. Hence the 18O condenses more readily at colder altitudes than at the surface, enriching the droplet with more heavy 18O. This means that the isotope ratio (δ18O), is directly dependent on the difference in partial pressure ratios of 16O and 18O between ocean surface temperature and the local dew point
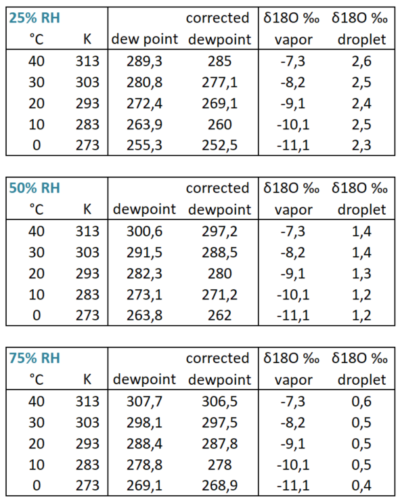
Fig 2 Initial d18O values for water vapor and first condensing droplets depending on temperature and relative humidity.
Let’s illustrate this process with an example calculation (fig 2). We calculate the δ18O from the first condensed raindrop. First of all, this is dependent of the δ18O of the surface water, and we assume it to be zero, although this is certainly not always the case. Next it’s depending both on temperature and relative humidity from the parcel of air after mixing at the moment it started to rise.
We compare different relative humidities, using rather dry (25% RH), average (50% RH) and moist (RH 75%) conditions in the three tables of fig 2. Surface temperatures are chosen between 0 – 40°C or 273 to 313 Kelvin (second column), which we need for the calculations. We can find the dew points using an online calculator. However we have to correct that for decreasing atmospheric pressure as the moist air parcel is lifted to condensation altitude, and we compute the corrected dew point (fourth column) for instance, using an emagram(fig 3), using the method as indicated on the inserted figure (source fig 7).
Fig 3. Emagram, used to plot vertical temperatures and moisture of rising air parcels, and cloud base depending on surface temperature and surface dew point as indicated in the insert
Then from fig 1 in excel we obtain the best fitting trend line, we are using that to estimate the 16O vs 18O partial pressure ratio of the water vapor at that temperature. To get the δ18O of the droplet after condensation, we repeat that process for the corrected dew point. However since the condensation yields fractionation in the reverse order we subtract the value from the δ18O of the vapor to get the δ18O of the water droplet in the last -sixth- column. It shows that even the large temperature variation 0-40°C causes relatively little variation in the δ18O of the initial water droplets (less than 10%). However the initial relative humidity i.e. 25%, 50% and 75% give a variation of for δ18O of 2.4‰, 1.3‰ and 0,5‰
[1] Hence, we see that the isotope ratio for δ18O condensing into the first water drop is hardly dependent from the temperature but much more dependent on relative humidity.
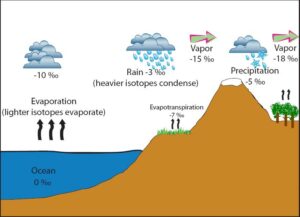
Fig 4 Illustrating the Rayleigh rain out process source: https://serc.carleton.edu/microbelife/research_methods/environ_sampling/stableisotopes.html
The transportation phase, the Rayleigh effect
A second process that determines the final δ18O isotope ratio on the ice cores is the Rayleigh raining out process (fig 4). As the 18O enriched droplet becomes rain, it removes itself from the environment. Consequently, the remaining water vapor in the environment is -even more- depleted with 18O, and more so, when the rain drops contained more 18O. As the air mass moves pole wards this process continues, more water vapor condenses to 18O heavier droplets, raining out continuously depleting the remainder of the vapor, until it arrives over the ice sheets, where it drops its last, heavily 18O depleted, snow. And obviously it will be more depleted when the rain drops contained more 18O, and as we have seen, this was directly depending on the relative humidity of the source.
Secondly, water vapor contains latent heat, which is released during condensation, reducing the cooling rate of the air mass on its journey. Obviously the more water vapor (higher specific humidity), the more energy and more reduced cooling. Consequently at these higher temperatures the rate of 18O fractionation during condensation is less, reducing the depletion rate of the remaining vapor and the final precipitation will contain a higher δ18O. As the specific humidity is temperature depending at 100% relative humidity in the clouds, it appears that this release of latent heat is the main mechanism of the paleo thermometer of the ice cores. Specific humidity will be low during colder conditions but the reverse is not automatically true, during arid conditions the specific humidity will also be low, regardless of the temperatures. Also under very moist conditions with moderate temperatures, the specific humidity will be higher and the ice cores will receive precipitation with higher δ18O, erratically suggesting higher temperatures.
[2] Hence, when the path from water vapor source to the final destination of the ice core is longer, more heavy isotopes will rain out, leaving the final precipitation stronger depleted of 18O. The same is true when the specific humidity of air mass is lower, reducing the release of latent heat, cooling the air mass stronger, increasing the rain out of 18O.
It has been observed that winter precipitation is more depleted in 18O and progressively more so to the higher latitudes as well as further away from the oceans and at high elevations.
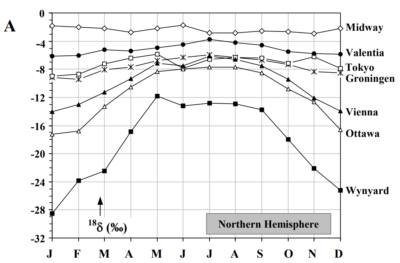
Fig 5 Seasonal variation of average d18O in precipitation
Fig 5 shows average seasonal variation on the northern hemisphere. Wynyard is in Saskatchewan, central Canada, with a continental climate, suggesting that the Rayleigh rain-out is much stronger during the winter months, which seems to support the notion of the very low specific humidity in those conditions. Also, the main evaporation source, depending on the sea surface temperatures will recede further away when the oceans cool, prolonging the Rayleigh rain out of 18O. On the other hand the slight variation of Tokyo despite considerable summer winter temperature temperature variation , but with a much shorter pathway from the moisture source seem to confirm the notion that the main variation in isotope rain out occurs during the Rayleigh process.
Accumulation and storage in the ice cores
In addition to the aforementioned complications even more problems arise in the ice cores. We see here the accumulation of snow in seasonal layers and like Wynyard (fig5) there is distinct difference between summer and winter snow as can be seen in the recent years. However, as the annual layers get buried it gets compressed under the weight of the overlaying snow, eventually merging the seasonal isotope variation layers into one average as Cuffey[iii] ahd Jouzel[iv] also observe. Consequently the final δ18O in an annual layer is the weighted average of the ratio of the amount of summer and winter accumulation as well as the seasonal variation in δ18O. Consequently, if winter snow precipitation is impeded by extreme cold, the amount of cold winter snow is low compared to the summer snow and as a result the average isotope temperature would indicate a warm year. Alternately, if for some random reason the summer would be warm but arid with normal winters, the amount of warm summer snow would be below average and the dominant cold winter snow would suggest a cold year. For instance if normally 25% of the snow is winter with δ18O of -30‰ and 75% is summer snow with a δ18O of -10‰ then the yearly average δ18O would be -15‰. Now if the summer snow is reduced by half then both 50% winter (δ18O=-30‰) and summer (δ18O=-10‰) would result in an average of δ18O=-20‰. A 5‰ change without any temperature change.
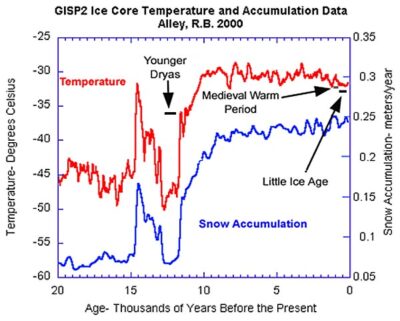
Fig 6 Reconstruction of “temperatures” and snow accumulation of the GISPII ice cores of Greenland.
With this in mind we recall Alley[v] which we examined earlier about the Younger Dryas. Fig 6 shows a fragment of data processing of a Greenland ice core from. The red graph “temperature” is actually a calculation based on the isotope ratio, δ18O. Hence instead of representing temperature; if it would represent relative humidity, that would explain why it is in good correlation with ‘snow accumulation’. However we have also observed in that linked article that the Younger Dryas was about wide spread aridness and warm summers, which suggests that it also might have affected the ratio in summer and winter precipitation.
[3]Variation in ratio of summer and winter precipitation at the ice sheets result in average annual δ18O variation, that cannot be attributed to temperature changes.
Conclusion
The ratio of isotopes between 16O and 18O in water is modified due to fractionation processes during condensation and evaporation in the global water cycle. Contrary to common belief, however, this process is not a primary function of temperature of the source, but of humidity. The initial fractination of the first condensation is largely dependent on the temperature difference between the sea surface and the dew point, a direct function of relative humidity. During the transportation to the poles, the rain out of heavy isotopes is further dependent on the release of latent heat and hence dependent on specific humidity. Specific humidity can he higher at higher temperatures but not necessarily so. Arid/moist swings play a dominant role here. Finally the ice cores have an additional complication for the variable ratio in accumulation of seasonal precipitation. Both factors may actually explain the Younger Dryas anomaly as an arid period rather than a cold snap. All in all these complications seem to invalidate paleo-temperature reconstructions, solely based on isotopes in ice cores.
Finally
In future contributions we will further explore anomalies like these, examining Maritime Isotope Stage 3 in comparison with Antarctic ice cores, oceanic foraminafera records and Milankovitch cycles in order to find an improved explanation for the ice ages of the Pleistocene.
Notes and references
[i] Dansgaard W 1964 Stable isotopes in precipitation, Tellus, Volume 16, Issue 4, pages 436–468, November 1964
[ii] Helsen M. M., R. S. W. Van De Wal, M. R. Van Den Broeke, D. Van As, H. A. J. Meijer, C. H. Reijmer, 2005, Oxygen isotope variability in snow from western Dronning Maud Land, Antarctica and its relation to temperature, Tellus 57B, 423-435
[iii] Cuffey, K. M.; Clow, G. D.; Alley, R. B.; Stuiver, M.; Waddington, E. D.; Saltus, R. W. 1995, Large arctic temperature change at the Wisconsin-Holocene glacial transition Science, 270: 455 – 458
[iv] Jouzel, J. Alley, R.B. Cuffey, K.M. Dansgaard, W. Grootes, P. Hoffmann, G. Johnsen, S.J. Koster, R.D. Peel, D. Shuman, C.A., Stievenard, M. Stuiver, M. White, J, 1997. Validity of the Temperature Reconstruction from Water Isotopes in Ice Cores; Journal of Geophysical Research Vol 102, No C12 pp 26,471-26,487, November 30
[v] Alley, R.B. 2000. The Younger Dryas cold interval as viewed from central Greenland. Quaternary Science Reviews 19: 213-226.
André, I hope to see a discussion on ao
– the reason the Milankovitch cycles don’t seem to have much influence before ~2,6 mya.
– the Quaternary glaciation seems to have started when the deep oceans cooled below ~2C coming from ~18C some 85 mya.
– the reason the deep oceans (near the ocean floor) were so hot around 85 mya.
https://wol-prod-cdn.literatumonline.com/cms/attachment/05742d58-c82d-47bc-80e5-4da1f48f8607/jgrc12191-fig-0009.png
Most of this information is from Benthic Foraminafera reconstructions.
Relevant articles:
agupubs.onlinelibrary.wiley.com/doi/full/10.1029/2011JC007255
researchgate.net/publication/263205991_Evidence_for_global_cooling_in_the_Late_Cretaceous
Hi Ben,
Most certainly there are ideas to discuss. The general problem with all these paleo-reconstructions is that hasty shaky conclusions are soon treated as being set in stone. So if one is not willing and able to challenge them, you’re not getting any further.
However if you’re prepared to comtemplate that isotopes in precipitation may not be about temperature and if you accept that d18O of foraminafera is very sensitive to bicarbonate/carbondioxide concentrations, then the world of the past may become completely different.
Plenty more coming.
Congratulations on this website. It is refreshing to see some real well informed climate science for a change and it is strikingly revealing of just how ill-founded so much of the the mainstream research actually is.
Beste Andre
Over de Milankovich cyclus.
De fysische werking daarvan is niet goed verklaard.
Het volgende heb ik bedacht,
Als er een dynamische balans is, dat zijn de cycli, dan is er ook een dynamische structuur die dit bewerkstelligt. Daar zit dan een fysische element, achtergrond in. Het is daarom een fysisch proces, en moet als zodanig verklaarbaar zijn.
In dit voorbeeld zou je het kunnen toepassen op de cycli.
Het heelal dijt uit, de Aarde, het zonnestelsel en de Melkweg circuleren. Is er een verschil meetbaar of deze processen met de uitdijingsrichting mee, gelijk daaraan of daartegenin plaatsvinden. Als dat zo is dan zouden we beter kunnen voorspellen of dit van invloed is op de zwaartekracht, de beweging van de planeten en daarmee op het klimaat.
Is dit wel eens onderzocht?
Kun je daar iets over zeggen?
Gerrit, sorry about the delay. Priorities.
I do think that the Milankovitch pertubations are well understood in classic Newtonian mechanics with some elements of relativity. https://en.wikipedia.org/wiki/Milankovitch_cycles
1: The most common orbit shape is elliptical and can easily be calculated. The variation in eccentricity is attributed to the variation in the position of Jupiter.
2. Precession is a bit more complex. Hipparchus already noted the precession of the equinoxes and it was calculated to be 26 k-year. It was Newton (of the apple) who explained the cause to be the torque of the gravity forces of sun but mostly moon on the equatorial bulge of the earth. And torque causes precesssion in a gyroscope. However the precession of the perihelion/aphelion (Apsidal precession) of about 19- 23 k-year is also influenced by the movement of the elliptical https://en.wikipedia.org/wiki/Apsidal_precession
3. Axial tilt is probably even more complex. I remember seeing a study about it, finding it’s cause as a secondary effect of precession. Unfortunately I could not find that back.
I’m not aware of other even more complex causations of the Milankovitch cycles.