
Frans van den Beemt
Computing HITRAN data, basic global temperature increase for doubling CO2 is limited to 0.16K-0.20K
Guest contribution by Frans van den Beemt
Full version of an earlier summary
Long read.
Abstract
We analyzed CO2 absorption and emission of infrared radiation and calculated the upper limit of a possible temperature increase at the earth’s surface, including the effect of average annual cloud cover. We used HITRAN spectral data and the general laws of physics and quantum mechanics for the calculations. We found 1.33 Wm-2 additional absorption for doubling CO2. Assuming that 40-50% will be emitted into space and 50-60% contributes to a surface temperature increase, we find a worst case upper limit of 0.16K-0.20K. We assess that the assumptions in IPCC report 2014 of 3.8Wm-2 and 1K increase respectively are overestimated.
Samenvatting
We analyseerden de CO2-absorptie en emissie van infraroodstraling en berekenden de bovengrens van een mogelijke temperatuurstijging aan het aardoppervlak, inclusief het effect van de gemiddelde jaarlijkse bewolking. We hebben berekeningen gemaakt met behulp van de HITRAN spectrale gegevens en de algemene wetten van de natuurkunde en de kwantummechanica. We vonden 1,33 Wm-2 extra absorptie voor het verdubbelen van CO2. Ervan uitgaande dat 40-50% daarvan wordt uitgestraald naar de ruimte en dat 50-60% bijdraagt aan een stijging van de oppervlaktetemperatuur, vinden we een bovengrens van 0,16K-0,20K. We tonen hiermee aan dat de aannames in het IPCC-rapport 2014 van respectievelijk 3,8 Wm-2 en 1K stijgen, te hoog zijn ingeschat.
Introduction
Infrared (IR) active gasses (like H2O, CH4, CO2) in our atmosphere interact with IR emissions of the Earth’s surface. In this article we focus on the physics of this interaction for Carbon Dioxide (CO2) only. CO2 molecules absorb IR radiation from the surface and this energy is transferred to the surrounding molecules by collisions, which propagate it further into the never resting atmosphere. CO2 molecules also have their own spontaneous and induced IR emission. Part of the IR emissions from the surface as well as from the atmosphere and clouds will be emitted into space, cooling the Earth. The net absorbed radiation in the Earth’s atmosphere controls its temperature. The question is how much an increase in CO2 concentration affects the atmosphere temperature at the surface. This temperature depends on several physical processes: evaporation, condensation and ice crystal formation, precipitation, cloud formation, aerosols, convection, wind, gravitation, Earth’s rotation and the radiation properties of its IR gasses.
Commonly numeric methods are used to compute the relationship between CO2 concentration and atmospheric temperature, based on well formulated radiation transport equations through the atmosphere. After each calculation cycle the results are corrected for other physical processes. Here we took a different and overarching approach. Firstly, we calculated an upper limit for absorption of energy (additional absorbed energy) by CO2 in the atmosphere for a doubling of the CO2 concentration. Then we used this additional energy to compute a best guess of a temperature rise, taking into consideration a global yearly average cloud cover as a result of convection and advection processes. This shields incoming radiation of the sun as well as outgoing IR radiation from the surface and atmosphere. The IR emissions of the clouds are assumed to contribute to emissions into space as well as to emissions towards the surface. We did not use the radiation transport equations because we computed the maximum possible absorption by CO2 molecules, which requires no specific details of the radiation transport.
Methods
We focus on the troposphere, where virtually all radiation interactions occurs. Also collisions between molecules here are fast enough to nullify additional spontaneous emissions and ensure transfer of absorbed energy to all molecules of the atmosphere, mainly to N2 and O2. We use the theory and formulas derived from Beer–Lambert law, Kirchhoff’s law, Planck’s law, Stefan–Boltzmann law and Einstein coefficients for emission and absorption.
Calculations and Results
We calculate the absorption of infrared radiation by CO2 molecules in the atmosphere under global mean conditions, initially ignoring effects of H2O molecules. We consider a one dimensional system perpendicular to the Earth’s surface and assume the Earth’s surface emitting black body radiation upwards. We limit ourselves to the 15µm band the main absorption band of CO2. At first we disregard the temperature and pressure gradients, using average values at the Earth’s surface.
Using Planck’s law for black body radiation, the formula for radiation intensity I is:
(1) dI/dϑ = Iϑ = 2πhϑ / λ2 * 1/ {exp(hϑ/kT) – 1}
At frequency ϑ=15µm,
λ=c/ ϑ, c=299792458 m/s light velocity in vacuum,
T=300K , Planck constant h= 6.6*10-34 J s ,
Boltzmann constant k= 1.38*10-23 J K ;
with I is radiation intensity we calculate dI/dϑ(15µm, 300K) = 1.7*10-11 J m-2. For the second important CO2 frequency at 4.3µm we calculate dI/dϑ(4,3µm, 300K)= 3.15*10-13 J m-2 or only 2% of the value for 15µm, that’s why we will focus further on the most important spectral band at 15µm.
References for formula (1): [R.Kronig 1966; page 1012 formula (9)][i], [A.Yariv 1968;page 87 formula (5.3-4)][ii], [R.Goody 1989; formula (2.37)][iii] and [H. Harde 2013;page 7 formula (50 and 51)][iv]
Absorption per unit traveled:
(2) d Iϑ /dx = -λ2/8π*A*g(ϑ)*Nco2(j)*Iϑ where Iϑ is given by (1)
x is radiation path length in meters (or height above Earth’s surface)
A=1,35 s-1 : Einstein coefficient of spontaneous emission
g(ϑ) : normalized line shape function with natural line width Δϑ(1 atm)= 4.2*109 Hz
Nco2(j) or N(j): population CO2 molecules for rotational quantum number j
References for formula (2): [A.Yariv 1968; page 210 formula (13.3-15)]ii, [R.Goody 1989; formula (2.54)]iii and [H. Harde 2013; page 9 formula (55) and page 5 formula (32)]iv
References for rotational quantum number j: [R.Kronig 1966; page 570 a.f.]i, [W.Witteman 1986;section 2.3][v] and [R.Goody 1989; section 3]iii
(3) Nco2(j) = Nco2 * (2hcB/kT)* (2j+1)*exp{-hcB/kT*j(j+1)}
B: rotational constant =0,39 cm-1
For j=20 we get: Nco2(20)= 5,64.1014
References for formula (3): [W.Witteman 1986; page 17 formula (2.20)]v, and [Laurendeau 2005;Page 180 Formula 9.37][vi]
References for rotational constant B: [W.Witteman 1986; Page 23 tables]v, and [Rothman 2004; HITRAN 2004 database][vii]
The total absorption over the traveled distance x and over all frequencies ϑ is computed by integration of Iϑ.d ϑ from minus infinity to plus infinity, resulting in:
-λ2/8π*A*Nco2(j)* Iϑ
where integration of g(ϑ).dϑ from minus infinity to plus infinity = 0 and Iϑ is constant over g(ϑ) for black body radiation.
At pressure broadening normalized line shape function becomes:
(4) g(ϑ) = ½*π* abs{Δϑ}/{ (ϑ – ϑ0)^2 + ( Δϑ/2)^2 }
References for formula (4): [A.Yariv 1968;page 211 formula (13.3-19)]ii, [W.Witteman 1986; page 12 formula (2.8)]v, [R.Goody 1989; section 3]iii and [H. Harde 2013;page 3 formula (7) and page 6 formula (39)]iv
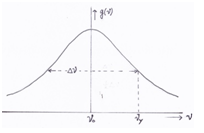
Figure 1: normalized line shape function g(ϑ) with natural line width Δϑ
Abs{Δϑ} = I ϑx – ϑ0 I the standard deviation (half value) is reached at y where ϑy is the frequency where g(ϑy) = ½*g(ϑ0) , see Figure 1.
In the x direction the radiation travels over a path L through the atmosphere.
Integration of (2) over height x from x = 0 to x = L provides a radiation intensity at x=L:
(5) Iϑ (L) = Iϑ (x=0)* exp{ -L*λ2/8π*A*g(ϑ)*Nco2(j) }
The remaining radiation intensity after absorption depends on the value of the exponent { -L*λ2/8π*A*g(ϑ)*Nco2(j) }
If we chose { L*λ2/8π*A*g(ϑ)*Nco2(j) } = 1 the value of the exponent becomes exp{ -1) = 1/e (with e =~ 2,71). At a distance x= L there is 1/e left of the original intensity Iϑ (at x=0) at a certain value of ϑ . This is already less than the standard deviation (half value). Three times the standard deviation equals a decrease of the original intensity Iϑ (at x=0) of 95%. Consequently if the computed traveled distance is L, for which the value of the exponent = -1 then at a distance 3L the radiation will be absorbed by 95% or more.
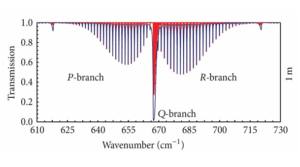
Figure 2: taken from [H. Harde 2013;page 20 Figure 13]iv: Absorption spectra for 380 ppm of CO2 in dry air at 1m propagation length (air pressure: 1013 hPa, temperature:288K).
To get an impression of the absorption in the side lobes, for the P-branch we consider the adjacent spectral lines for j = 20 and j = 22. Note that the R-branch produces similar results. The central frequencies of the relevant spectral line belonging to each value of j originate from the HITRAN database [Rothman 2004]vii, a table of values measured in laboratories. The intersection at which the two wave functions (spectral lines) overlap is called x with frequency ϑx and probability distribution function gx (ϑx).
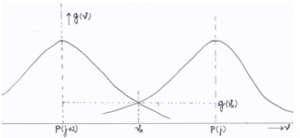
Figure 3: Overlapping spectral lines for j and j+2 in the P branch
The HITRAN database allots the line frequencies for each rotational quantum number j of the P and R branch of the CO2 15 µm V2 rotation-vibrations spectrum. For example j=20 and j=22 we find: P(20) = 651.94 cm-1 and P(22) = 650.41 cm-1 and P(20)-P(22) = 1.53 cm-1 or 4.59*1010 Hz. The absolute value of the frequency band between the central frequency ϑ0 of each line till the intersection point ϑx then amounts to: I ϑx – ϑ0 I = ½*4.59 * 1010 Hz.
With (4) we calculate gx(ϑ)=9.12*10-13 at the overlap or crossing point x between these two lines P(20) and P(22) (see Figure 3). g(ϑ) get its value of 9,12.10^-13 at point x that lies at a distance (frequency band) of abs{ϑx – ϑ0} away from the center ϑ0 of g(ϑ).
With (5) and { -L*λ2/8π*A*g(ϑ)*Nco2(j) } =-1 we find L=160m. We have now absorption for P(20) as well as for P(22) where these lines overlap. For each line we will have >=50% absorption within L=½*160=80m. This means that a fraction >=95% of the radiation is absorbed within L=3*80=240m; three times as far from the center ϑ0 of g(ϑ)
We determine for which value of j more than 95% of the radiation is absorbed over a distance of 3 km. At this distance the absorption decreases with roughly a factor 2 (Table 5) due to decreasing pressure and temperature with altitude. The path length for more than 95% absorption will then increase with this same factor 2 up to 6km. We find that for side-lobs with j<=46 more than 95% of the infrared radiation originating from the Earth’s surface will be absorbed in the troposphere.
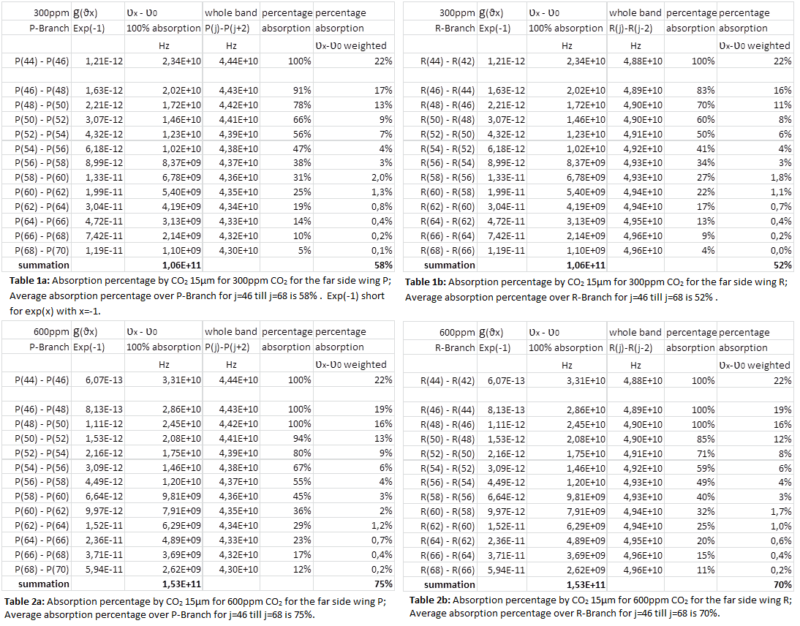
For the increase in absorption in the troposphere for spectral lines with J>=48 we assume that the value g(ϑx) for which the argument of the exponent becomes -1 in combination with a characteristic height of L=1 km (so that 3L=3km) provide us the full (100%) absorption frequency band ʋx – ʋ0. The results are listed in the next four tables 1a and 1b and 2a and 2b. The absorption percentage is calculated as the full absorption band around a spectral line center for a certain j number divided by half of the whole band taken as the band between the two centers for line J and line J+1. The weighted absorption percentage is calculated as (ʋx – ʋ0) * (percentage absorption).
The complete CO2 15 µm V2 vibration band has a central part with J<=44 that fully absorbs LWIR in the Troposphere and a part for J>=46 with less absorption in the far side wings P and R. With (1) we calculate the absorption, using an averaged absorption over the far side wings, with from data the HITRAN database 2004 to determine the frequency band (and wavenumbers). The center line is 667 cm-1. From the center line to the far wings we find P(46)=632 cm-1 and R(46)=705 cm-1. For the far side wings with j=72 we find P(72)=614cm-1 and R(72)=726cm-1. These bandwidths are common for the far side wings P and R of CO2 15µm (see Figure 2) in use to determine the additional absorption at doubling CO2 concentration in our atmosphere. The additional absorption and as a derivative thereof the temperature increase at the surface is shown in Table 3.
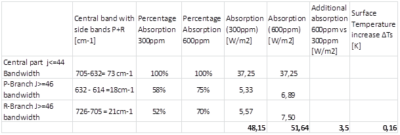
Table 3: Additional absorption for 15µm at doubling CO2 concentration and surface temperature increase (see explanation below this table). Absorption [W m-2] = Bandwith [cm-1]*100*speed of light at vacuum[m.s-1]* dI/dϑ(15µm) [J m^-2]*Percentage Absorption . With (1) we find dI/dϑ(15µm, 300K) = 1.7*10-11 J m-2 .
For the temperature increase at the surface (ΔTs) we use the following calculation, assuming a yearly and global mean situation where all dynamics are averaged.
For a more realistic picture we introduce the cloud cover factor α (or cloudiness factor) because of its direct effect on the incoming and outgoing radiation. Furthermore we ignore any effect of water vapor. See the formula and results in Table 4. For the cloudiness factor we use the international accepted value of 0,62 (62%) as a global and yearly average [Kiehl, 1997, Page 200][viii].
P(total emission to space) = P(clear sky emission of surface to space) + P(emission to space from cloud tops) – P(clear sky under the assumption half of Ph is lost to space).
P(emission to space from upper side clouds) is the emission at global average cloud cover approximately at 5km height and at 250K and for simplicity the value is taken as half of the emission from the surface at 300K.
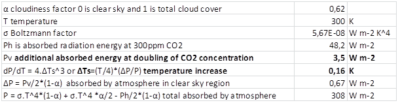
Table 4: Calculation of the temperature increase at the surface ΔTs due to the additional absorbed energy Pv as calculated and shown in Table 3.
Assumption
In our yearly and global average situation via convection and radiation half of Ph and Pv is assumed to enter space and half is assumed to cause a temperature increase at the surface (ΔTs). To get an impression how this affects the resulting temperature increase we calculate the results without these assumptions. So all Ph and Pv would contribute to a temperature increase at the surface we get the following results: ΔTs=0.60 for α=0 and ΔTs=0.32 for α=0.62.
At much higher CO2 concentrations than 600ppm the percentage absorption (as used in Table 3) approaches 100% for the P and R branch. At 100% for both side wings assuming proportionality we calculate as in Table 3 an additional absorption of 9 W m-2 and a temperature increase of 0.42K at the surface, which sets the limit for possible temperature increase for rising CO2.
Variation of the cloud cover has a certain effect on ΔTs: for α=0.50 we find upper limits for ΔTs=0.20 K and for α=0 clear sky ΔTs=0.30K. The actual increase of the temperature ΔTs will be lower.
Two examples that underpin our upper level calculation approach are:
- The absorption per unit traveled is proportional to the population CO2 molecules for rotational quantum number j : N(j) see Formula (2). In reality the extra absorbed Pv decreases more rapidly with height than in the upper limit calculation above ( 1atm and 300K at all heights above surface) and as a result ΔTs will be lower than calculated here. For the first 5 km we provide some figures about height above surface, pressure and temperature and the with height decreasing factor for the number of molecules N(j). We have used this factor 2 while chosing an characteristic height above the surface of L=1 km in order to calculate the absorption in the far wings, see text above Table 1a.
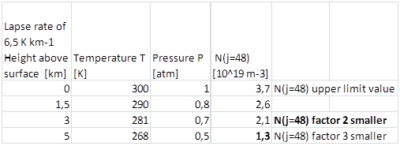
Table 5: Influence of decreasing temperature and pressure with altitude on N(j=48) while absorption per unit traveled is proportional to N(J). First N(48) is calculated for each temperature with Formula 3. This outcome for N(48) is multiplied with the pressure at each altitude to correct for density.
- In our upper limit calculations we ignore H2O vapor to calculate the maximum absorption by CO2 Water spectral lines show overlap with CO2 lines in the region of 15µm. In reality this overlap will decrease the real absorption, attributed to CO2.
Conclusion
We present a straight forward calculation method, which results in maximum values for extra absorption by CO2 667 cm-1 (15µm) for a CO2 concentration increase of choice.
At CO2 doubling from 300ppm to 600pppm and 62% cloudiness we found an increase of absorbed energy with a maximum of 1,33W m-2. Due to convection processes that sets the temperature profile and laps-rate and due to symmetry and random direction of spontaneous emissions half of this: 0,67W m-2 would provide an increase of the surface temperature. The calculated maximum temperature increase of 0.16K appears negligible in respect of the complexity of the atmosphere and the temperature differences over the globe.
[H. Harde 2013]iv found 2.6W m-2 and 0.3K (at clear sky and Ts=288K and water vapour content of 1.46% and CO2 doubling from 380ppm to 760ppm, cloudiness of 50% at 5km height), [H. Hug 2012][ix] found 0.2K (for CO2 doubling from 200ppm to 400ppm). The IPCC AR5 report of 2014 states that a double CO2 concentration provides 3.8W m-2 radiation energy that warms the air near the surface about 1K, without climate feedbacks. Our results do not support this notion.
Calculation spreadsheet available (soon) on request.
About Frans van den Beemt
Frans obtained his MSc physics in June 1973 at the University of Technology, Eindhoven, The Netherlands and his PhD in Science Studies, June 2000, University of Leiden, The Netherlands
He held positions as Teaching Assistant, University of Technology, Eindhoven, The Netherlands, then as Research Fellow, Department of Experimental Nuclear Physics, University of Technology, Eindhoven, The Netherlands. Next he was teacher in Physics and Mathematics, Eckhart College, Eindhoven, The Netherlands, System Engineer, Machines & System Group Holec, Ridderkerk, The Netherlands and Program Director, Technology Foundation STW, Utrecht, The Netherlands He is founder of consulting firm: VdBeemt 2G Advies and founder of European academia consulting firm: HandsonGrants. He authored numurous publications and performed many specialized functions.
Notes and references
[i] R. Kronig, Leerboek der Natuurkunde Scheltema & Holkema NV Amsterdam
[ii] Amnon Yariv Quantum Electronics, California Institute of Technology, book second edition 1968
[iii] R. M. Goody and Y. L. Yung, Radiation: Theoretical Basis, Oxford University Press, Oxford, UK, 1989.
[iv] Herman Harde Radiation and Heat Transfer in the Atmosphere: A Comprehensive Approach on a Molecular Basis, Hindawi —Publishing Corporation International Journal of Atmospheric Sciences, Volume 2013, Article ID 503727, 26 pages (2013) http://dx.doi.org/10.1155/2013/5037
[v] W.J. Witteman , “The CO2 Laser” December 1986 Springer Series in Optical Sciences Springer-Verlag
[vi] Normand M. Laurendeau, Statistical Thermodynamics Fundamentals and Applications, book Cambridge University Press 2005
[vii] Rothman, L. S. et al, (30 authors), J. Quant. Spectrosc. Rad. Trans. 96 139-204 (2005), ‘The HITRAN 2004 molecular spectroscopic database’
[viii] J.T. Kiehl and K.E. Trenberth, Earth’s Annual Global Mean Energy Budget, Bulletin of the American Meteorological Society Vol. 78, No. 2, February 1997 [Kiehl, 1997]
[ix] Heinz Hug, Der anthropogene Treibhauseffekt – eine spektroskopische Geringfügigkeit , Wiesbaden (August 2012) https://www.eike-klima-energie.eu/wp-content/uploads/2016/12/Hug-pdf-12-Sept-2012.pdf
As the post is linked to on facebook, discussion happen out there. I’ll post some revelant remarks:
1
2
3
4
5
Reply van Frans van den Beemt aan vragenstellers (27-01-2019)
1)Collisions intervals are around 10^-8 s and CO2 15µm V2 vibration level a spontaneous emission relaxation time of around 0,74s.
2) CO2 15µm V2 vibration level starts to emit freely to space from around 76km-80km in the thermosphere at emission temperatures between 210K and 220K for the center lines. But the wings emit from the troposphere at much higher temperatures that vary with CO2 wavelength so a line by line calculation is necessary. Increase of CO2 concentration increases the emission height proportional with pressure and emission temperatures also differ. But around these same height from around 80km the temperature profile changes from decreasing to increasing with height and the outcome for a doubling of CO2 has to be measured and is not well determined. This emission temperature has an influence on the surface temperature. In satellite measured absorption spectra these low CO2 emission temperatures becomes visible.
3) Please explain the question further.
4)See my answer to 3) The Video of prof. Murry Salby is a correct and fine analyses of what we experience today.
Frans can you explain where your calculations differ from Myhre et al and why tour approach is better?
Hans,
I assume that you refer to Myhre et al 1998 ( https://agupubs.onlinelibrary.wiley.com/doi/epdf/10.1029/98GL01908 ).
I’m afraid that their detailed calculations are not readily available and I doubt if we can get that comparising going. However, the message between the lines is clear. The calculations of Frans do invite independent robust duplication attempts. All details are available. If Frans is wrong, then he is wrong. Just anybody proof it.
Dear Hans Erren, I know the difference with IPCC in general and klimate models that make use of radiation transport equations (RTE). Most assume Local Thermodynamic Equilibrium (LTE). RTE under LTE lead in itself to 36K km-1 T laps-rate close to the surface. Convection processes are taken into account to correct for these results and the combination of RTE (LTE) and convection makes the results more close to what we measure. My approach differ (not better) in order to cope with complexity and to understand the role of CO2 in our atmosphere. The side wings of CO2 15micronmeter band are the most important in case of doubling CO2 concentration from 300 until 600 ppm. I have calculated the upper limit of the additional absorbed energy in these side wings and found very low figures. These low figures suggest that further detailed calculations are not worthwhile. It is quite well possible that CO2 (at doubling 2xCO2) compensate in itself the additional (side wings related) energy within the lower troposphere with additional emitted energy in its central band in lower stratosphere after a shift to higher emission levels (2xCO2) and increased emission temperatures in the Ozon region.
André,
The formula for temperature in point 4 is just rewriting the definition for scale height (H). The ratio P/rho is equal to H * g.
Inserting this expression in the temperature formula gives the definition of H= T * R/(g * n). The formula you mentioned does not ‘predict’ anything, it just expresses the gaslaw.
André and Frans,
When I examine several spectra in MODTRAN I deduce that the saturated P and R wings emit at ~20km (220K), just above the tropopause, the spike of the Q branch emits somewhat higher in the stratosphere, at ~35km (240K). The non-saturated outer parts of the P and R wings emit in the troposphere.
I don’t understand why the thermosphere is mentioned, it starts at about 80 km, it has a very low density and temperatures up to 1500K (in MODTRAN the height can be adjusted to max 70 km).
Thanks, Dirk interesting.
I think that your first statement (“The ratio P/rho is equal to H * g.”) is identical to the computation of the dry adiabatic lapse rate (https://en.wikipedia.org/wiki/Lapse_rate#Dry_adiabatic_lapse_rate): dP=-ρgdZ
However I am not sure if this is related to Frans equation (4) about the pressure broadening normalized line shape function: (4) g(ϑ) = ½*π* abs{Δϑ}/{ (ϑ – ϑ0)^2 + ( Δϑ/2)^2 }
I agree that the thermosphere would not play a significant role in the energy balance of the atmosphere. It appears to be irrelevant.
André,
I referred to the formula of Frolly about calculating planetary surface temperatures… The temperature determines the P/rho ratio. The scale height in the atmosphere is the altitude for which the pressure decreases a factor e.
Thanks, I guess that would be 1000frolly. https://www.youtube.com/watch?v=V0jdPQ9aGbY
I intend to post on that later this year.
Dear Dirk, I agree the lower stratosphere contributes the most to the central CO2 emissions, already from a 40 km height looking down it seems that all emissions are gathered.
In theory also the mesosphere contribute. So you are right. The temperature inversion in the lower stratosphere makes a higher CO2 concentration emits some more from the central CO2 lines or more cooling of the Earth system. The opposite is true for the far side wings especially the R branch, these two mechanism regulate the net cooling or warming, but because of convection processes and clouds the net outcome is not obvious. The additional absorbed energy will be first distributed conform Boltzmann ” before” emissions take place. So part of the additional energy also will be emitted to space but not via CO2 molecule. gr. Frans
Frans if you are using a 1 atmosphere layer with ambient CO2 concentrations, then to get to the total absorption path that exists in the earth’s atmosphere you must use a scale height of 8043 m.
I don’t see a scale height in your calculations.
https://klimaathype.wordpress.com/2015/12/14/over-de-verzadiging-van-het-co2-spectrum/
Dear Hans Erren, I see no need because already in the first few meters CO2 absorbs the largest part, only the far side wings are not saturated and are absorbing in the whole troposphere.
But Frans it is the total absorption integral over the partially saturated wings that determines the logarithmic sensitivity.
Dear Hans Erren, that is right. The contribution of absorption for a certain path lenght is estimated.
I have a suggestion.I know it is a huge project that takes political courage and millions of dollars but we have invested to go to the moon why not invest to
Reinplant he Sahara dessert using only plants that produce more O2 than CO2 that will take CO2 from the air and increase even the ozon-layer
Dear Andre Nahr, it is not necessary to remove CO2 until we reach 1200 ppm, which is an indoor norm for buildings where people work and live. Best regards, Frans van den Beemt
De dynamische balans als uitgangspunt om onze impact op het klimaat te bekijken.
Als er een dynamische balans is dan zijn het altijd dynamische structuren die deze balans beïnvloeden.
Dat is een fysisch proces en als zodanig te herleiden. Hoe zit de dynamiek in elkaar, wat is wel dynamisch en wat is er niet dynamisch in dit proces, daar moeten we ons op focussen.
Het klimaat is bij uitstek een dynamisch proces, je ziet dat deze dynamische balans door menselijke invloeden veranderd, maar ook door natuurlijke processen, dat onderscheidt kan wetenschappelijk worden bepaald.
We zouden deze veranderingen in de dynamische balans beter is kaart moeten brengen, en daar dan de discussie over voeren. Dat is pragmatischer dan vanuit een veelheid van losse onderzoeken een model realiseren, je ziet dat daar een eigen inzicht aan wordt ontleent. We zijn het overzicht daar in kwijt geraakt en dat moeten we terug vinden. We moeten de eenvoud weer ontdekken, en daar ons onderzoek op richten. De dynamische balans mag je zien als een vereenvoudiging ten opzichte van computermodellen die niet goed onze tekortkomingen weergeven. Een dynamische structuur doet vanuit een balans dat wel, de balans moet corresponderen met de waargenomen feiten, anders klopt het niet. Dat is beter dan dat we een computermodel modeleren ten opzichte van de waarnemingen.
Ik zal dat met een voorbeeld illustreren.
In de atmosfeer zweven de gasmoleculen. Dat zweven is een balans. Wat beïnvloed dat zweven, dat is duidelijk zichtbaar de temperatuur. Nu gaan we kijken naar de dynamiek van de temperatuur in dat proces. Het omzetten van vloeistof naar een gas kost energie. Is dat een vast of een dynamisch proces? De wet op behoud van energie biedt hierin uitkomst. De warmte inhoud van water is anders, ongeveer twee maal groter dan van waterdamp. Deze omzetting van waterdamp naar water en andersom is niet dynamisch. Het kost wel energie maar een groot deel van die energie zit verborgen in de grotere of kleinere warmte inhoud van het molecuul.
Dan is de volgende vraag is van belang hoe wordt de dynamiek die je ziet in het stijgen en dalen van moleculen overgebracht. Daar zit een balans in, en de dynamische structuur daarin is daarom fysisch herleidbaar.
Geleiding of convectie kan het niet zijn, het gaat over teveel energie, dan moet de dynamiek door infrarode straling ontstaan. Een werverstorm of orkaan wordt vooral gevoed door infrarode straling. Nu zie je dat straling op zichzelf niet dynamisch is, het bestaat uit deeltjes, kwantums. Daarom is de uitstraling van een bos anders dan van een stad. Een bos bestaat voor een groot deel uit water, en heeft zo een andere invloed op de dynamiek van de stijg en daal processen in de atmosfeer dan een stad. Je ziet dat een bos het klimaat ook verder weg positief beïnvloedt.
Je kan daarnaast vanuit dit inzicht naar luchtdrukverschillen kijken.
Is de luchtdruk een constante of een dynamisch proces. Waarom zweven moleculen bij een luchtdruk van 10000 kg per m2. Je ziet duidelijk een balans in hoe moleculen zweven in de atmosfeer, hoe ontstaat die balans zuiver fysisch gezien. We kunnen wat dit betreft nog eens goed kijken naar dit proces.
Je ziet dat de valsnelheid van twee ongelijke gewichten gelijk is recht richting het middelpunt van de Aarde. Is dat andersom met de stijgsnelheid van moleculen in gas of vloeistof toestand ten opzichte van de druk ook zo. Zo te zien ja, als je naar de diepzee kijkt dan zie je dat bij die enorme druk de stijgsnelheid voor het oog vrijwel gelijk is. Dan is de stijgsnelheid puur temperatuur afhankelijk. Luchtdruk verschillen die we zien zijn daarmee ook temperatuur afhankelijk. En dat luchtdrukverschillen voornamelijk een gevolg zijn van de temperatuur. De draaiing van de aarde is ook een constante factor hierin op elke breedtegraad. De atmosferische druk is een constante gezien vanuit de zwaartekracht. De vrijheidsgraad is wel afhankelijk van de zwaartekracht. En temperatuur brengt de dynamiek in dit proces.
De dynamiek die we zien in het dalen en stijgen van lucht door temperatuursveranderingen kunnen we zo beter in kaart brengen. Maar ook dat de hoeveelheid infrarode straling voor het belangrijkste deel de dynamiek verzorgt in dit proces. En dat de frequentie bij absorptie of uitstraling zeer belangrijk is als we over klimaatverandering nadenken. Dat is voor ieder broeistofkasgas anders.
Daarom is de rol van CO2 niet linieer met de verwachte temperatuur stijging in computermodellen.
sorry, mijn Engels in niet voldoende.
Beste Gerrit Vermeer, Ik zal hier wat langer over na moeten denken, geef mij een week of zo. I have to think about this comment, it will. take me a week ar so to provide a reply.